Enhancing Greyscale Image Contrast through Histogram Equalisation
May 22, 2023
Freddy

Image processing is an integral subfield of computer vision, a field which has been on the rise as part of AI. In this article, we take a look at histogram equalisation: an important tool to increase image contrast. We focus exclusively on greyscale images.
Let’s start with a demo.
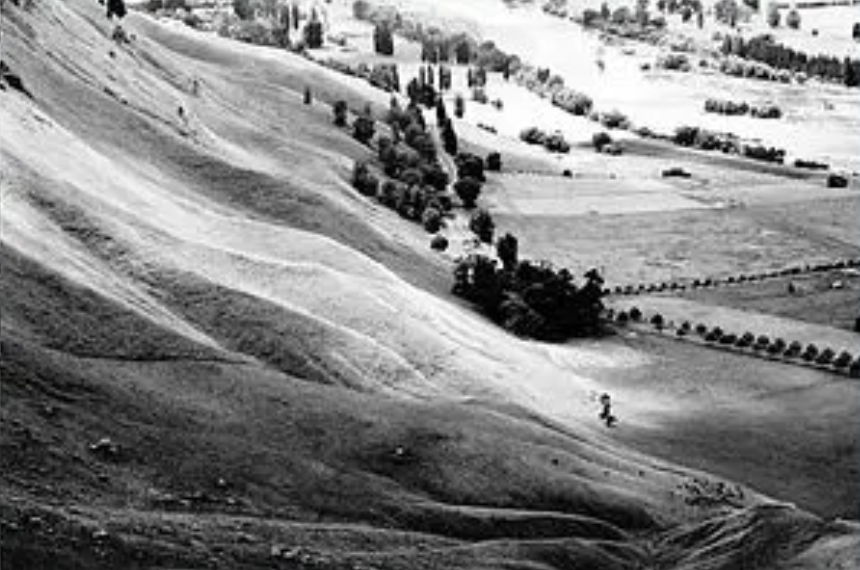
The upper image is the original image and the lower image is the enhanced image. You can also upload your own image. (Note: The program assumes your image is greyscale. It will always output a greyscale image.)

Pretty neat, right?
The program above uses a technique called histogram equalisation. The fundamental motivation behind histogram equalisation is to increase contrast of images. Image enhancing has many use cases, such as increasing quality of a retro photograph for forensic analysis (or just to make it look nicer!) and preprocessing medical scans before feeding them to train a convolutional neural network.
Histogram equalisation is mainly used for greyscale images, but it is also possible to apply this on colour images. We explore this in another article.
How does histogram equalisation work?
If we want to enhance contrast of an image, we must spread out its pixel intensities. The easiest way to achieve this without considering the surroundings of each pixel would be to define a one-to-one mapping from each pixel intensity to a new one.
For example, here’s the (cropped) mapping for the example hills photo. Note that intensity values range from 0 (black) to 255 (white).
| Original intensity | 133 | 134 | 135 | 136 | 137 | 138 | 139 |
|---|---|---|---|---|---|---|---|
| New intensity | 20 | 26 | 35 | 46 | 58 | 64 | 77 |
How do we define the mapping?
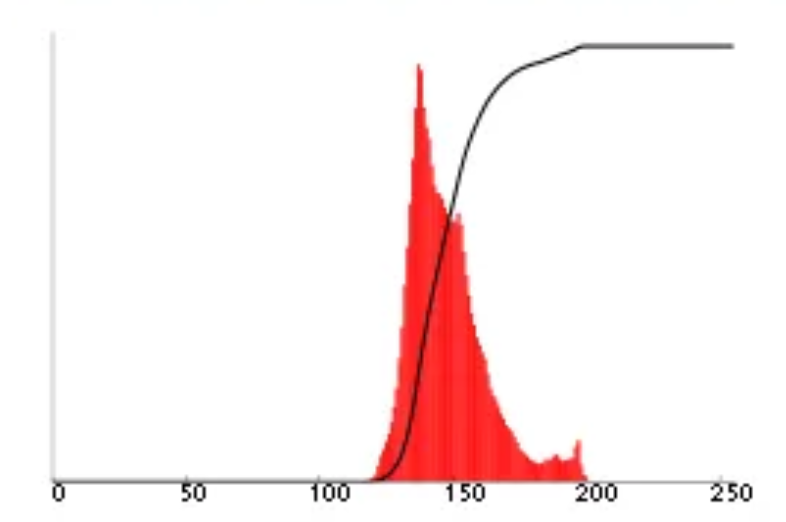
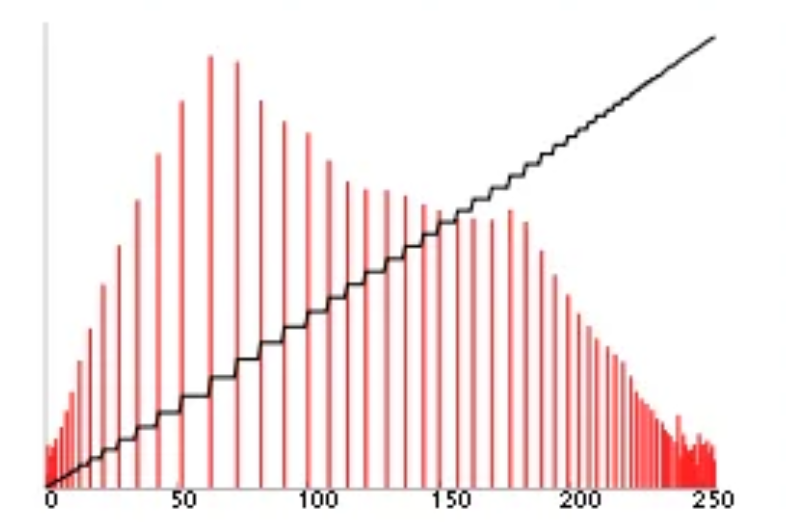
We start by counting the number of pixels with each intensity, then build a histogram of pixel intensities.


We also plot the CDF (i.e. the black line). The idea is to define the mapping so that the new CDF resembles a straight line.


This is how histogram equalisation works visually. Now, let’s formally describe its mathematics!
Behind the scenes: Mathematics
Let \(x\) be input image and \({x_{i, j}}\) be intensity of the pixel at \({(i, j)}\).
Define the normalised histogram of \(x\) as:
\[h_\phi = \frac{\sum_{x_{i, j} \in x} \mathbf{1} \left( x_{i, j} = \phi \right)}{\text{# pixels in $x$}} \quad \forall \phi \in [0, 255]\]Note that \({\mathbf{1}}\) denotes the indicator function.
Then equalisation application is defined as:
\[g(x_{i, j}) = \text{floor} \left( 255 \sum_{\phi=0}^{x_{i, j}} h \phi \right)\]Let’s code histogram equalisation!
Histogram equalisation is so useful that it is included in almost every mainstream programming library, especially Python: pillow, scikit-image, PyTorch etc.
However, for learning purposes, let’s code this in vanilla JavaScript! The function below takes in a list of pixels (input image) and returns a list of pixels (equalised image).
function equalise(pixels) {
    // Pre: image is greyscale but in RGBA format

    // Intensity histogram
    const histogram = Array(256).fill(0);

    // += 4 since image is in RGBA format, so we consider every 4th value only
    for (let i = 0; i < pixels.length; i += 4) {
        index = pixels[i];
        histogram[index]++;
    }

    // Normalise histogram and create pixel mapper from cumulative histogram
    const mapper = [];
    let sum = 0;

    for (let i = 0; i < histogram.length; i++) {
        // Normalise histogram
        histogram[i] /= (pixels.length / 4);

        // Keep track of CDF
        sum += histogram[i];

        // Translate the maths formula to code
        mapper.push(Math.floor(sum * (histogram.length - 1)));
    }

    // Update pixels
    for (let i = 0; i < pixels.length; i += 4) {
        intensity = mapper[pixels[i]];

        pixels[i] = intensity;
        pixels[i + 1] = intensity;
        pixels[i + 2] = intensity;
    }

    return pixels;
}
I used this snippet of code for the interactive demo at the start of this article. In JavaScript, fetching the pixel data from an image is not trivial and involves rendering the image onto a canvas. You can find the source code here.
Further reading
- In this post, we focus on enhancing image contrast. What about enhancing image quality? A simple technique is to use a high-pass filter.
- Histogram equalisation and image processing is a subset of both computer vision and graphics.
- If you’re interested in the mathematics behind deriving the formulae, the University of California has a short paper.
- A lot of programming libraries are open source. This means you can view their implementation of histogram equalisation. For example, here’s pillow’s code. Fun fact: PyTorch’s implementation calls pillow’s function
More Blog Posts
The Intuition behind Convolutional Neural Networks
The UCI Protocol for Chess Engines
Setting Up Unrestricted ChatGPT Locally on Mac
Histogram Equalisation for Colour Images
Enhancing Greyscale Image Contrast through Histogram Equalisation
On the Philosophy and Design Choices of this Site
Benchmarking Loops in JavaScript
Looping Through a List in JavaScript