Programming Bezier Curves
May 8, 2022
Freddy

In a previous post, we explore concepts of Bezier curves. In this article, we will write a program in JavaScript that draws Bezier curves. As a disclaimer, we will not be covering everything (e.g. using the JavaScript canvas), only the fundamentals. Nonetheless, the source code is provided.
Click here for source code.
Coding the lerping
We start off by defining a class Point.
class Point {
  constructor(x, y) {
    this.x = x;
    this.y = y;
  }
}
Remember, the idea of Bezier curves revolve around linear interpolation. To lerp between 2 numbers \(x\) and \(y\), we use this equation:
\[(1 - t)x + ty \quad t \in [0, 1]\]We translate this directly into a method in Point.
lerp(x, y, t) {
  return (1 - t) * x + t * y
}
To lerp between 2 points, we lerp between the x-values and the y-values.
lerpWithPoint(other, t) {
  return new Point(
    this.lerp(this.x, other.x, t),
    this.lerp(this.y, other.y, t)
  );
}
This is the full code for our Point class.
class Point {
  constructor(x, y) {
    this.x = x;
    this.y = y;
  }

  /*
    lerp: linear interpolates between @x (start) and @y (end)
    - x: float
    - y: float
    - t: value between 0 and 1 inclusive
  */
  lerp(x, y, t) {
    return (1 - t) * x + t * y
  }

  /*
    lerpWithPoint: linear interpolates between this pointer and @other
    - other: other point
    - t: value between 0 and 1 inclusive
  */
  lerpWithPoint(other, t) {
    return new Point(
      this.lerp(this.x, other.x, t),
      this.lerp(this.y, other.y, t)
    );
  }
}
Coding the Bezier Curve
It’s time for the main event! Firstly, we need to store the control points.
class BezierCurve {
  constructor(points) {
    this.points = points;
  }
}
Now, we want to draw the Bezier curve, but how do we do that?
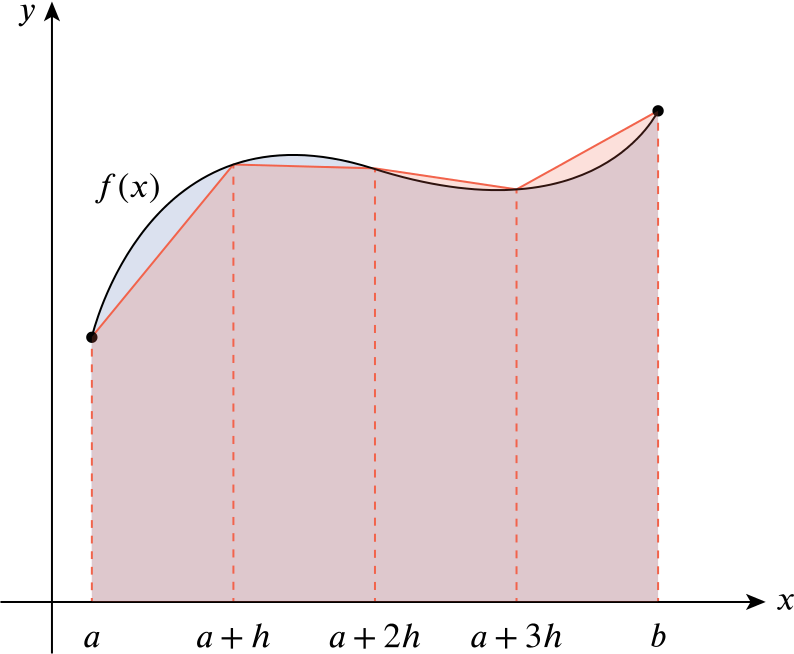
Consider any non-linear curve defined by a function \(f\). To render it on a computer, we must create a discrete approximation. We take samples of \(x\), find the \(y\) values and join them together with lines. In the image below, our rendered curve would be the red lines. If we take enough samples, the red lines will eventually look like a curve.

Bezier curves are non-linear, so we’ll do the same thing. Recall the construction of Bezier curves: the points on the curve are defined by the lerp value \(t\). So, we can take samples defined by \(t\).
Firstly, we write a method in BezierCurve that calculates the coordinates of
the point on the curve, given \(t\). This is directly translated from De
Casteujau’s algorithm.
sample(t) {
  let points = this.points;

  // Repeat until we get the point
  while (points.length > 1) {
    let nextPoints = [];

    // Calculate next iteration of points as lerp between 2 points
    for (let i = 0; i < points.length - 1; i++) {
      nextPoints.push(points[i].lerpWithPoint(points[i+1], t));
    }

    points = nextPoints;
  }

  return points[0];
}
Now, draw the Bezier curve by sampling. We use the JavaScript canvas, and have
omitted some boilerplate code (such as defining ctx), but refer to the source
code to see this in action.
function drawBezierCurve(curve, sampleInterval) {
  ctx.beginPath();

  let t = 0;

  // Perform sampling
  while (t <= 1) {
    let point = curve.sample(t);
    ctx.lineTo(point.x, point.y);
    t += sampleInterval;
  }

  ctx.stroke();
}
We are done!
Well, not quite.
To get this fully working, we need to bring in some HTML code and a canvas. If we do that, this is what our Bezier curve looks like!

Try it out yourself!
With a bit more work, we can extend this project to an interactive simulation. Drag the control points with your mouse.
More Blog Posts
The Intuition behind Convolutional Neural Networks
The UCI Protocol for Chess Engines
Setting Up Unrestricted ChatGPT Locally on Mac
Histogram Equalisation for Colour Images
Enhancing Greyscale Image Contrast through Histogram Equalisation
On the Philosophy and Design Choices of this Site
Benchmarking Loops in JavaScript
Looping Through a List in JavaScript